

Flooring manufacturer Mohawk Industries (NYSE:MHK) missed Wall Street’s revenue expectations in Q1 CY2025, with sales falling 5.7% year on year to $2.53 billion. Its non-GAAP profit of $1.52 per share was 8.2% above analysts’ consensus estimates.
Is now the time to buy Mohawk Industries? Find out by accessing our full research report, it’s free.
Mohawk Industries (MHK) Q1 CY2025 Highlights:
- Revenue: $2.53 billion vs analyst estimates of $2.55 billion (5.7% year-on-year decline, 0.9% miss)
- Adjusted EPS: $1.52 vs analyst estimates of $1.40 (8.2% beat)
- Adjusted EBITDA: $267.9 million vs analyst estimates of $269.9 million (10.6% margin, 0.7% miss)
- Adjusted EPS guidance for Q2 CY2025 is $2.57 at the midpoint, below analyst estimates of $2.81
- Operating Margin: 3.8%, down from 5.5% in the same quarter last year
- Free Cash Flow was -$85.4 million, down from $96.9 million in the same quarter last year
- Market Capitalization: $6.65 billion
Commenting on the Company’s first quarter, Chairman and CEO Jeff Lorberbaum stated, “In the first quarter, our sales were relatively flat on a constant basis, absorbing two fewer shipping days and year-over-year foreign exchange headwinds. The impact of missed sales and extraordinary costs from the new Flooring North America order system was within the expected range, and service has returned to historical rates. Our earnings performance primarily benefited from productivity gains, restructuring actions and a lower tax rate, which partially offset pricing pressure and higher input costs. During the quarter, we purchased 225,000 shares of stock for approximately $26 million.
Company Overview
Established in 1878, Mohawk Industries (NYSE:MHK) is a leading producer of floor-covering products for both residential and commercial applications.
Sales Growth
A company’s long-term sales performance is one signal of its overall quality. Any business can put up a good quarter or two, but the best consistently grow over the long haul. Over the last five years, Mohawk Industries grew its sales at a weak 1.7% compounded annual growth rate. This was below our standards and is a tough starting point for our analysis.
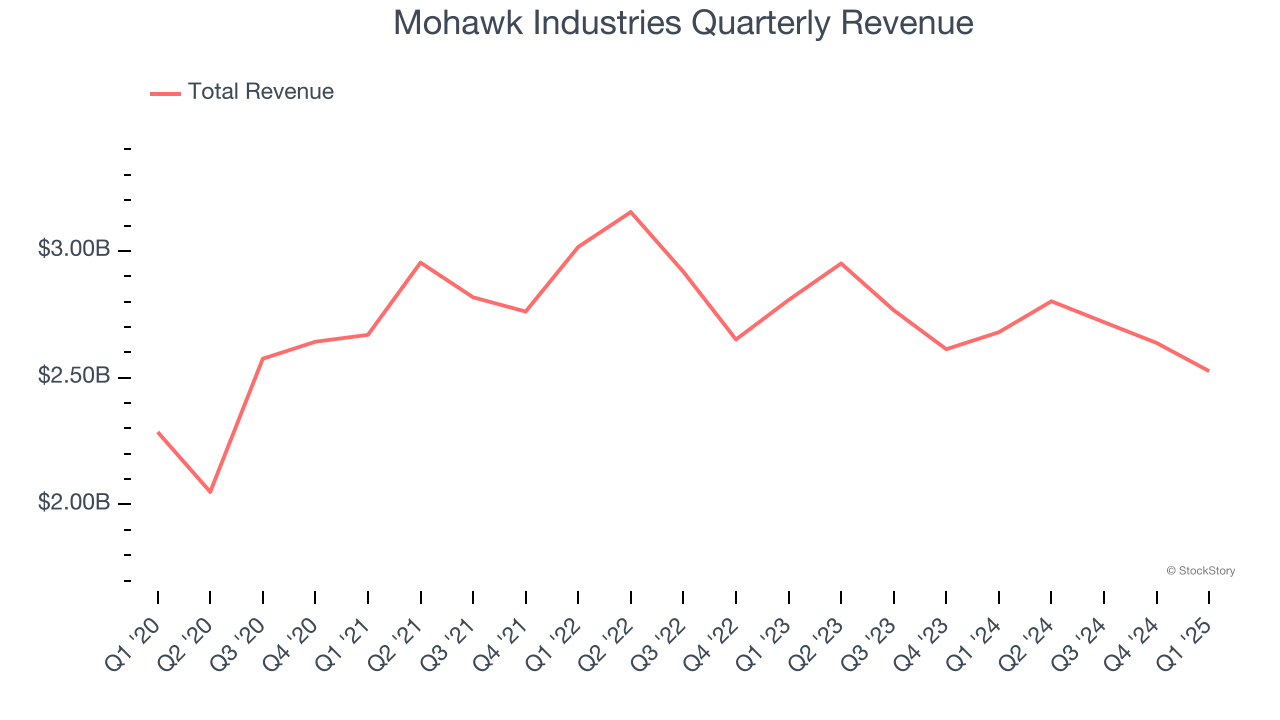
We at StockStory place the most emphasis on long-term growth, but within consumer discretionary, a stretched historical view may miss a company riding a successful new product or trend. Mohawk Industries’s performance shows it grew in the past but relinquished its gains over the last two years, as its revenue fell by 3.7% annually. 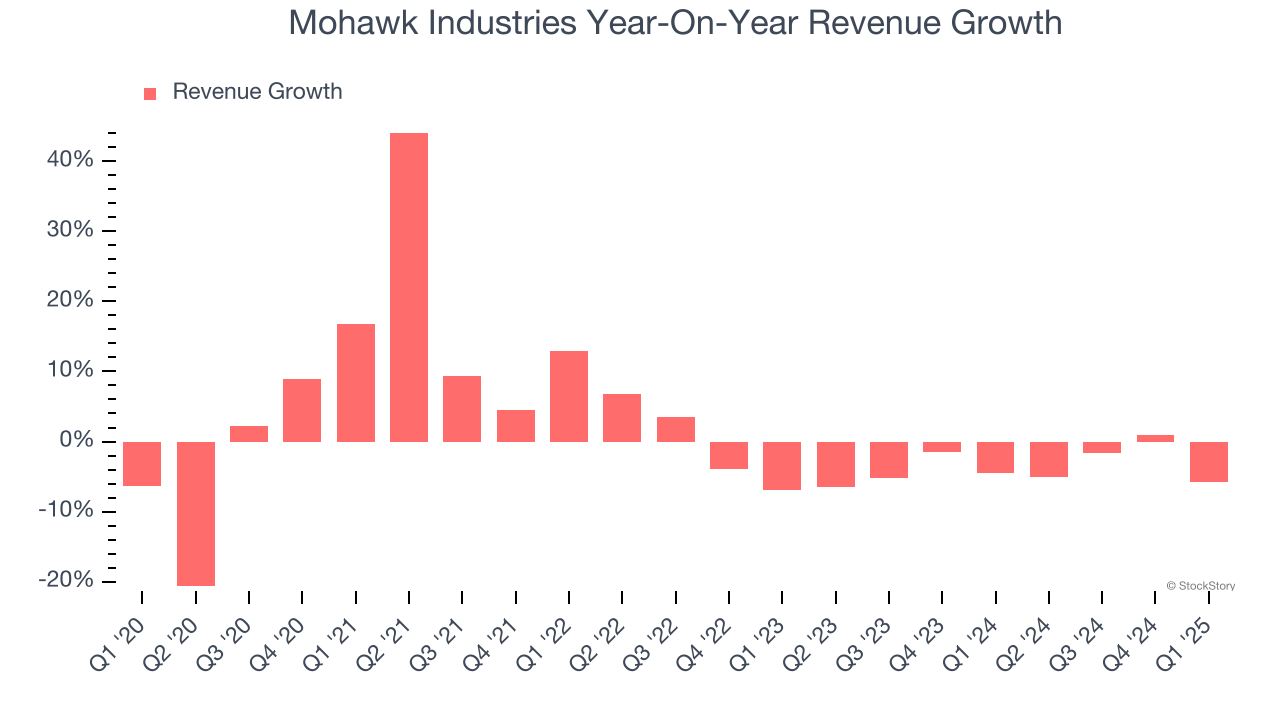
This quarter, Mohawk Industries missed Wall Street’s estimates and reported a rather uninspiring 5.7% year-on-year revenue decline, generating $2.53 billion of revenue.
Looking ahead, sell-side analysts expect revenue to grow 1.2% over the next 12 months. While this projection implies its newer products and services will fuel better top-line performance, it is still below the sector average.
Unless you’ve been living under a rock, it should be obvious by now that generative AI is going to have a huge impact on how large corporations do business. While Nvidia and AMD are trading close to all-time highs, we prefer a lesser-known (but still profitable) stock benefiting from the rise of AI. Click here to access our free report one of our favorites growth stories.
Operating Margin
Operating margin is an important measure of profitability as it shows the portion of revenue left after accounting for all core expenses – everything from the cost of goods sold to advertising and wages. It’s also useful for comparing profitability across companies with different levels of debt and tax rates because it excludes interest and taxes.
Mohawk Industries’s operating margin has risen over the last 12 months and averaged 1.7% over the last two years. The company’s higher efficiency is a breath of fresh air, but its suboptimal cost structure means it still sports inadequate profitability for a consumer discretionary business.
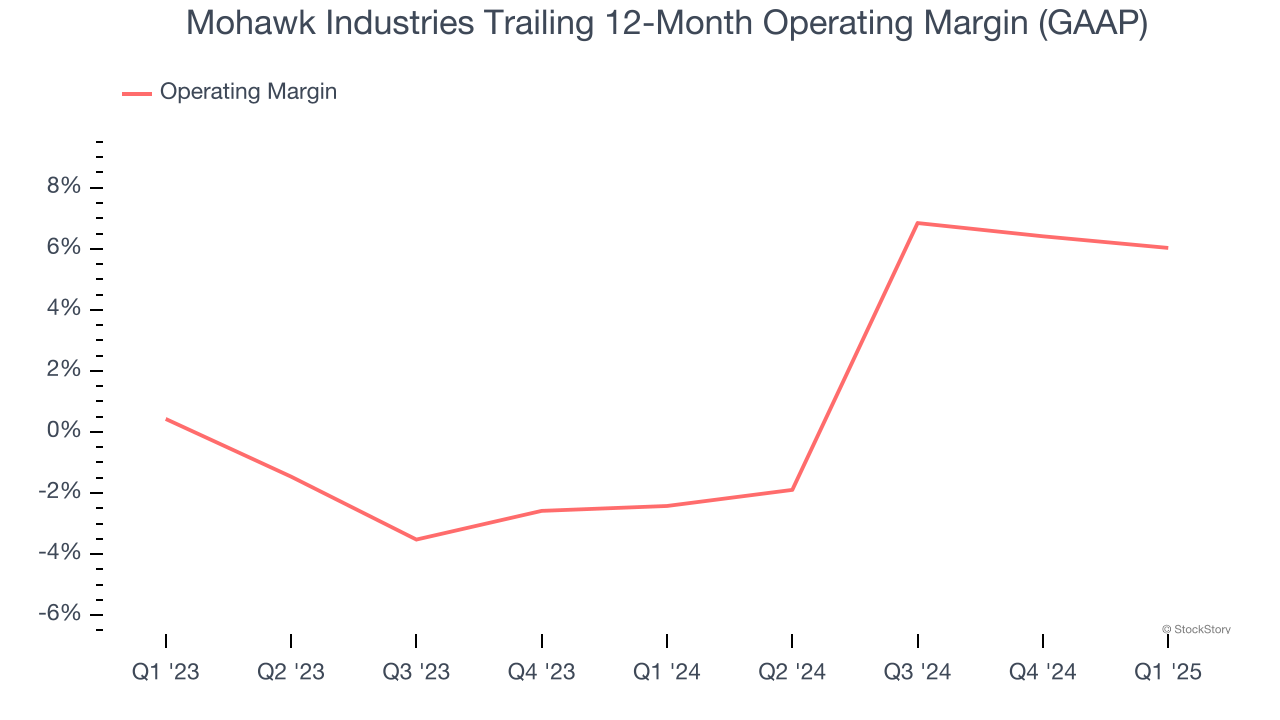
This quarter, Mohawk Industries generated an operating profit margin of 3.8%, down 1.7 percentage points year on year. This reduction is quite minuscule and indicates the company’s overall cost structure has been relatively stable.
Earnings Per Share
We track the long-term change in earnings per share (EPS) for the same reason as long-term revenue growth. Compared to revenue, however, EPS highlights whether a company’s growth is profitable.
Mohawk Industries’s flat EPS over the last five years was below its 1.7% annualized revenue growth. This tells us the company became less profitable on a per-share basis as it expanded due to non-fundamental factors such as interest expenses and taxes.
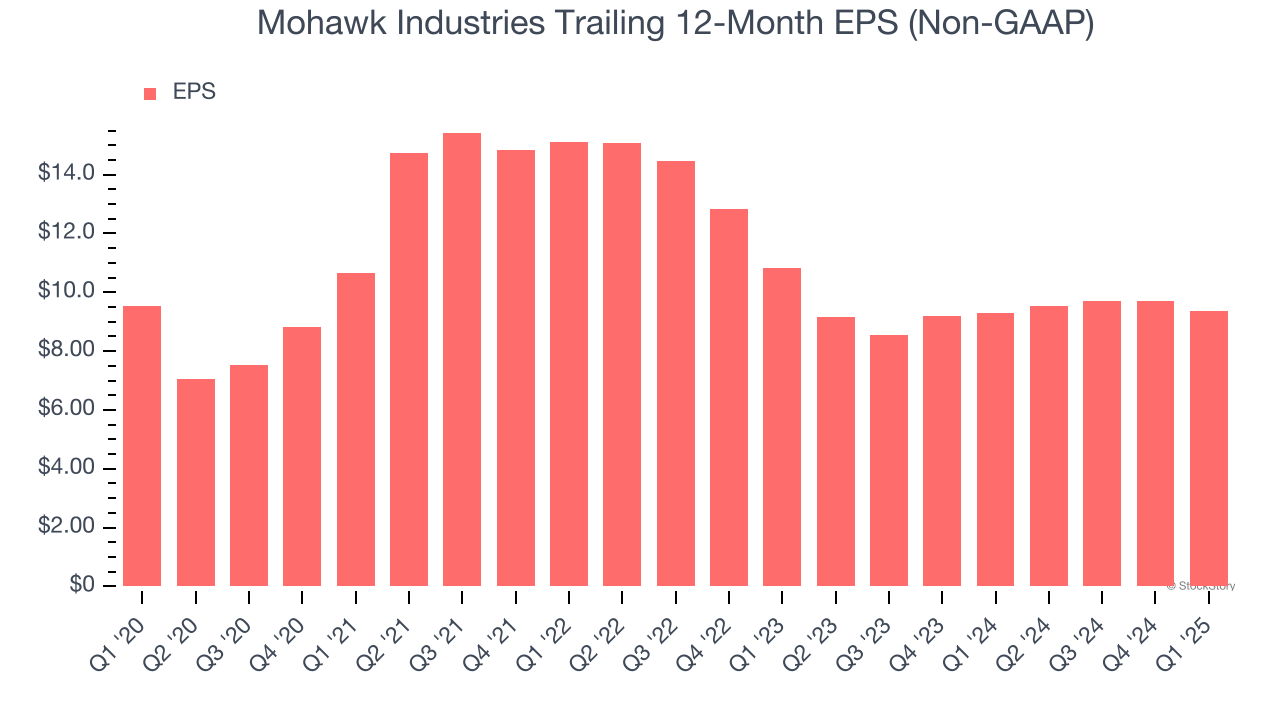
In Q1, Mohawk Industries reported EPS at $1.52, down from $1.86 in the same quarter last year. Despite falling year on year, this print beat analysts’ estimates by 8.2%. Over the next 12 months, Wall Street expects Mohawk Industries’s full-year EPS of $9.36 to grow 9%.
Key Takeaways from Mohawk Industries’s Q1 Results
It was encouraging to see Mohawk Industries beat analysts’ EPS expectations this quarter. On the other hand, its EPS guidance for next quarter missed and its revenue fell slightly short of Wall Street’s estimates. Overall, this quarter was mixed. The stock remained flat at $106.60 immediately after reporting.
Is Mohawk Industries an attractive investment opportunity at the current price? What happened in the latest quarter matters, but not as much as longer-term business quality and valuation, when deciding whether to invest in this stock. We cover that in our actionable full research report which you can read here, it’s free.